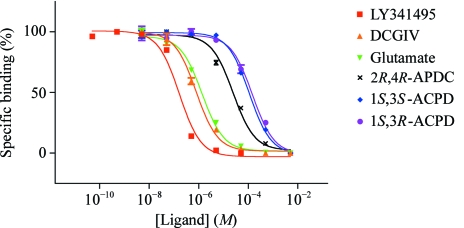
Figure 3.
Displacement of [3H]-LY341495 binding to the mGluR3 N414/439Q ECD mutant by the ligands. The data are plotted with the following symbols: red squares, LY341495; yellow triangles, DCGIV [(2S,2′R,3′R)-2-(2′,3′-dicarboxycyclopropyl)glycine]; green inverted triangles, l-glutamate; crosses, 2R,4R-APDC [(2R,4R)-4-aminopyrrolidine-2,4-dicarboxylate)]; blue diamonds, 1S,3S-ACPD [(1S,3S)-1-aminocyclopentane-1,3-dicarboxylic acid]; purple circles, 1S,3R-ACPD [(1S,3R)-1-aminocyclopentane-1,3-dicarboxylic acid]. Each point shows the mean ± standard deviation. The continuous lines indicate the curves representing the results of the corresponding sigmoidal fitting.

