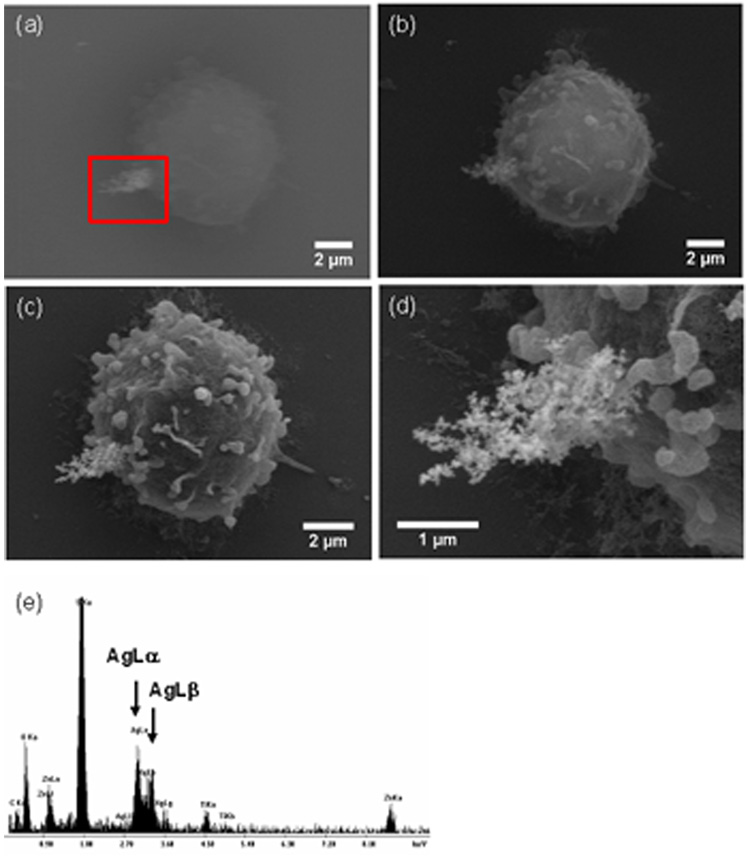
Fig. 4.
SEM images of BFU-CD54 COINs conjugated on U937 monocytic leukemia cell imaged using (a) backscattered electron (BSE) detector at 20kV showing the differences in contrast between COINs (at lower left of image) and cell; (b) corresponding secondary electron (SE) image at 20kV; (c) SE image at 5kV. This image taken at lower kV exhibits improved topographical contrast; (d) Higher magnification SEM image at 5kV showing the COINs; (e) Energy-Dispersive X-ray spectrum where the AgL lines confirm the presence of COINs. The cells were dehydrated with ethanol, critical point dried and sputtered with a thin layer of gold-palladium. Extra X-ray lines are from the glass slide. These SEM images are representative of the many that were obtained.

