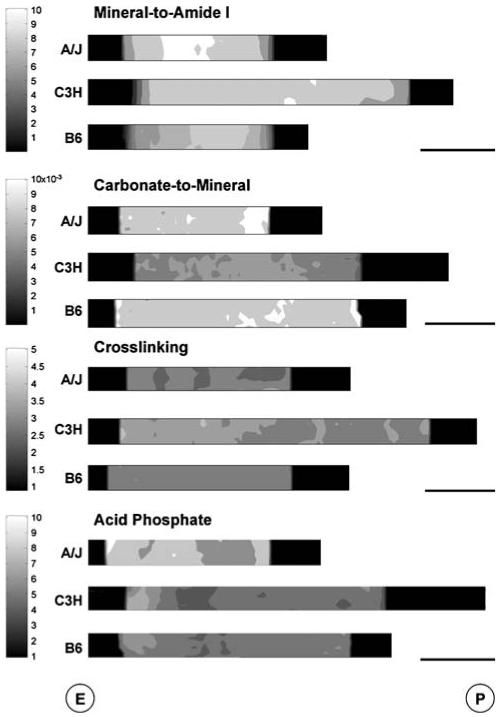
Fig. 4.

FTIR images showing representative spatial variation of spectral parameters among A/J, C3H, and B6 medial femoral cortices. Parameters shown are those for which at least one significant difference in mean trait values was found. Bar = 100 μm. E, endosteal surface; P, periosteal surface
