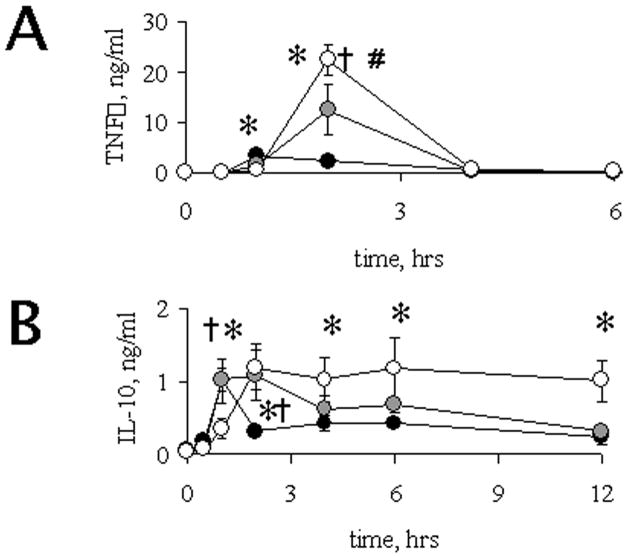
Figure 4.
Time-course of LPS-induced TNFα (A) and IL-10 (B) levels in rats of different age groups. TNFα and IL-10 were determined in serum of 6 mo (black circles), 15 mo (grey circles) and 23 mo (open circles) old rats at various times after LPS challenge as shown, LPS challenge was given at 0 h in x axis. †,*, # indicate significant differences (p < 0.05) between adults (6 mo) and middle aged (15 mo), adults and aged (23 mo), or middle aged and aged, respectively. Each point was studied in 3–5 animals from the different age groups. Values, Means ± SEM.

