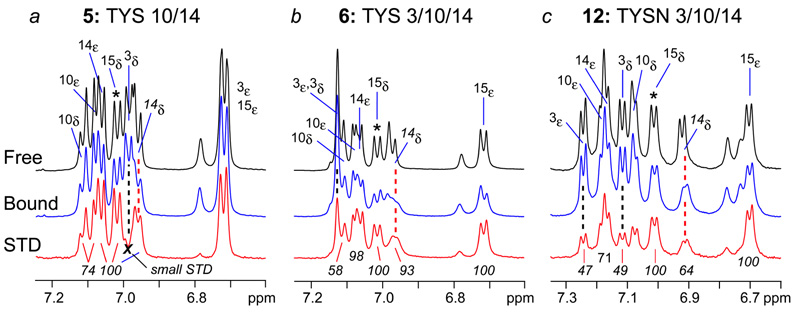
Figure 4.
Expansions of NMR spectra of 17-residue CCR5 Nt (2–18) and analogs. 1H NMR spectra of free and bound peptides are shown in black and blue, respectively, and 1H STD spectra of complexes are red. Number and position of TYS and TYSN residues are shown above respective spectra and in Figure 1 and Figure 5.

