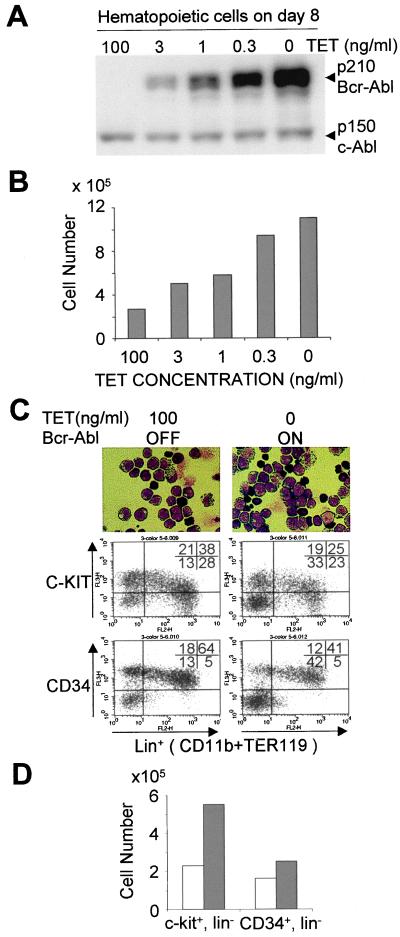
Figure 2.
A dose-dependent enhancement of immature hematopoietic cells by Bcr-Abl expression. (A) The expression level of Bcr-Abl protein is controlled by alteration of Tet concentration. The Bcr-Abl-inducible ES cells were differentiated by coculturing with OP9 stromal cells in the presence of 100 ng/ml Tet until day 5. The differentiated ES cells were subcultured (7 × 10⁵ cells per 10-cm dish) at various concentrations of Tet (100, 3, 1, 0.3, or 0 ng/ml), and 3 days later the hematopoietic cells that developed on the OP9 cell layers were harvested. Bcr-Abl expression was analyzed by Western blotting (on equivalent cell numbers) using anti-Abl antibody as described in Materials and Methods. (B) The number of hematopoietic cells on day 8 of ES cell differentiation cultured at various Tet concentrations. As described above, 7 × 10⁵ cells at day 5 were seeded on new OP9 layers and cultured at various concentrations of Tet. The hematopoietic cells were harvested on day 8 and counted. The expression level of Bcr-Abl protein at each Tet concentration correspond to those of Fig. 2A. (C) Immature hematopoietic phenotype of day 8 differentiated ES cells. Inducible Bcr-Abl ES cells are cultured in Tet on OP9 cell layers for 5 days. On day 5, one was maintained with Tet (100 ng/ml) to suppress Bcr-Abl expression (Left). Three days later, the clusters of hematopoietic cells were harvested and analyzed by FACScan and Giemsa staining. Both hematopoietic cell populations exhibited an immature morphological phenotype with occasional primitive erythroid cells (Top, ×500 magnification). (Middle and Bottom) The phenotype of cell surface markers in day 8 hematopoietic cells differentiated from the inducible Bcr-Abl ES cells. The expression of the c-kit or CD34 and lineage markers, CD11b (myeloid cells) and TER119 (erythroid cells) are shown. (Left) The Bcr-Abl-off condition with 100 ng/ml Tet added. (Right) Results for day 8 Bcr-Abl-expressing cells. (D) The number of day 8 c-kit+/lin− cells derived from inducible Bcr-Abl ES cells. Open bars show the Tet off-condition with 100 ng/ml Tet, in which Bcr-Abl expression of inducible Bcr-Abl ES cells are suppressed. Filled bars indicate the on-condition of Bcr-Abl expression. The experiment shows the mean of triplicate cultures. The results are plotted as total cell number of the designated phenotype per culture dish. Each experiment was carried out three times using four different clones. A representative result is shown.

