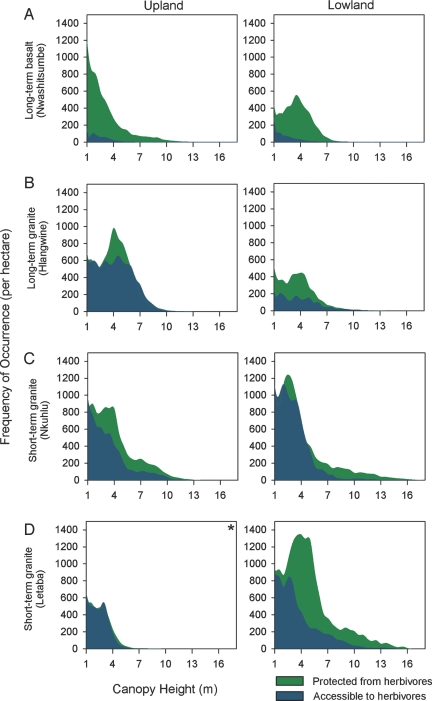
Fig. 2.
Frequency histograms of vegetation canopy height derived from 1640 ha (56-cm resolution) of airborne LiDAR observations. (A and B) Long-term treatments. (C and D) short-term treatments. In all panels, the left column is for uplands and the right column is for lowlands. Values are normalized by both site area and percentage of woody cover at each site. All panels except (D), uplands (*), show significantly different distributions using K-S tests (P < .01; n = 27,000).

