
Fig. 1.
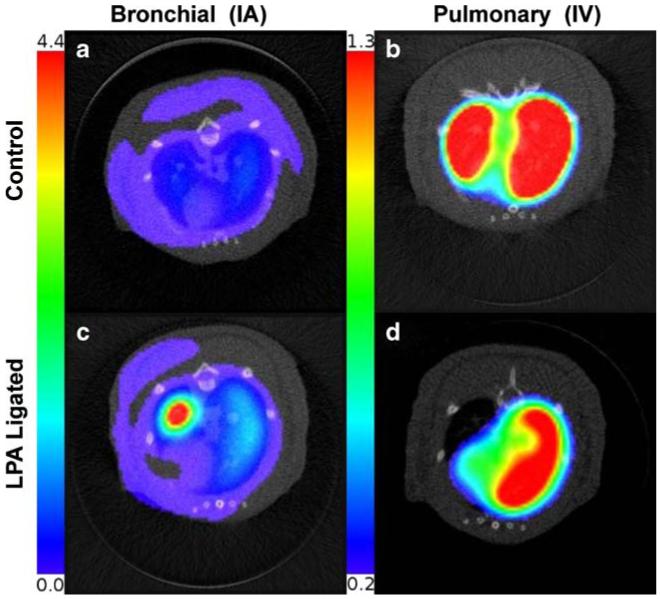
Co-registered micro-CT and SPECT reconstructions of a control rat imaged after IA injection of MAA: activity distributed uniformly in the entire systemic circulation of the rat; b control rat imaged after IV injection of MAA: activity distributed in left and right lungs; c LPA-ligated rat 40 days after surgery imaged after IA injection of MAA: activity distributed in entire systemic circulation, with increased activity in the left lung; d LPA-ligated rat imaged after IV injection of MAA: activity distributed only in the right lung. Color scale for IA and IV SPECT images is different to visualize low activity in bronchial circulation