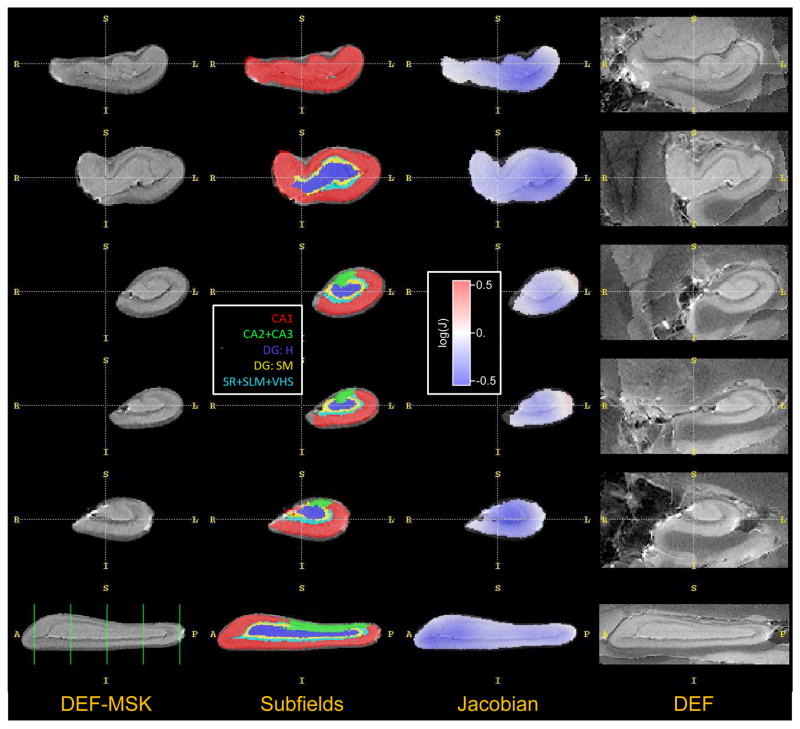
Fig. 12.
This figure plots the healthy/diseased asymmetry in TLE in a reference space, i.e., in the space of the postmortem hippocampus atlas. The left column shows 5 coronal slices and a sagittal slice through the postmortem atlas “DEF-MSK” (see Fig. 3), which is the atlas used in the TLE experiment. The second column shows the subfield labeling of the “DEF-MSK” atlas. The third column shows the logarithm of the Jacobian determinant of the mapping from the healthy hippocampus to the diseased hippocampus, averaged over all subjects. This average Jacobian map is computed by using shape-based normalization to transform the log-Jacobian maps shown in Fig. 11 back into atlas space, followed by computing the average. Negative values (blue) indicate local volumetric decrease (disease-associated atrophy); positive values (red) indicate local increase in volume. The last column shows corresponding slices from the non-masked postmortem atlas “DEF”, for the purpose of visualizing the adjacent tissues.

