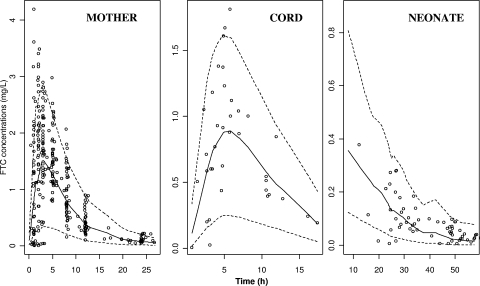
FIG. 3.
Evaluation of the final model. Comparison between the 5th (lower dashed line), 50th (full line), and 95th (upper dashed line) percentiles obtained from 1,000 simulations and the observed data (○) for FTC concentrations in mother (left panel), cord blood (middle panel), and neonate (right panel).

