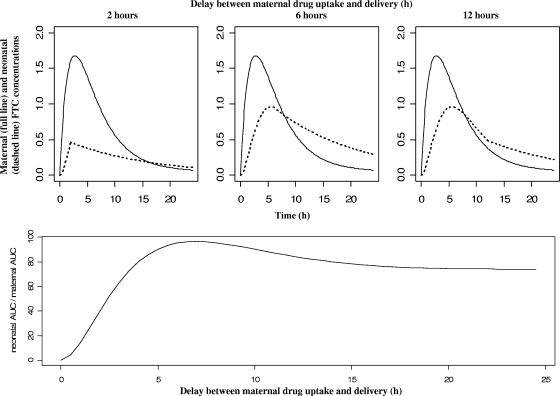
FIG. 4.
(Top) Population-predicted FTC concentrations in the mother (full line) and her neonate (dashed line) (cord blood equation before delivery and neonatal equation after) versus time for 2-h (left panel), 6-h (middle panel), or 12-h (right panel) delays between drug administration and delivery time. (Bottom) Neonatal to maternal FTC AUC ratio as a function of the delay between drug administration and delivery time.

