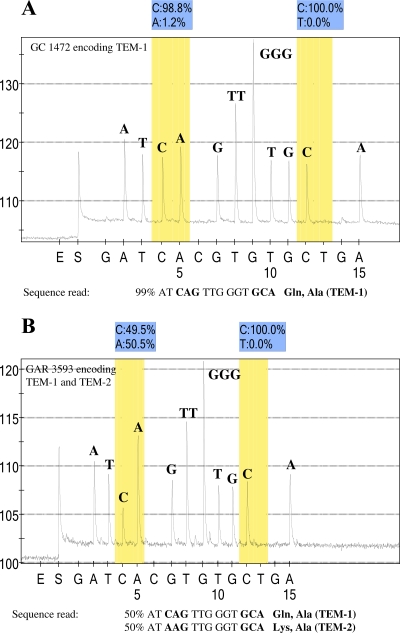
FIG. 2.
Pyrosequence analysis of blaTEM derivatives. (A) Pyrogram of sequence analysis of PCR products with primer TEM_up_39 and the template from isolate GC 1472 (TEM-1). This primer was designed to sequence through codons 39 and 42, which encode glutamine and alanine, respectively. The pyrogram indicates that the codons at positions 39 and 42 conform to the TEM-1 sequence. (B) Pyrogram of sequence analysis of PCR products with primer TEM_up_39 and the template from isolate GAR 3593. The pyrogram indicates an SNP in the codon at position 39, such that 50% of the sequences read CAG, which encodes glutamine, and 50% of the sequences read AAG, which encodes lysine. In contrast, the codon encoding position 42 reads GCA with 100% C residues at the polymorphic position of interest. The y axis represents the relative light units as a measure of nucleotide incorporation, and the x axis is the nucleotide dispensation order that is programmed into the instrument. Peaks indicate the level of the respective nucleotide incorporated. E, enzyme-only control; S, substrate-only control. The initial nucleotide injected (in this case, G) is irrelevant to the sequence in order to provide a baseline. The shaded bars indicate the potentially polymorphic position in the sequence, and the relative percentage of each nucleotide at that position is indicated directly above the pyrogram. An irrelevant nucleotide is programmed into the dispensation order following each polymorphic position of interest. In panel A, 1.2% of the A residues at the polymorphic position are below the level of background acceptable for SNP sequence analysis, according to the manufacturer (Biotage AB).

