
Figure 2.
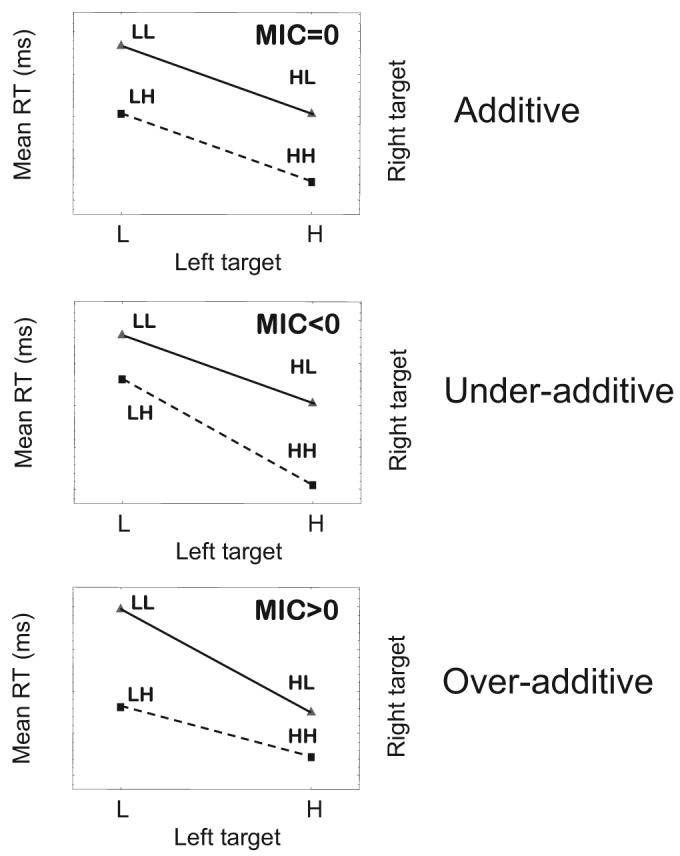
Schematic illustration of three main patterns of mean response times (RTs) and mean interaction contrasts (MICs). L = low-intensity target; H = high-intensity target.
Official websites use .gov
A
.gov website belongs to an official
government organization in the United States.
Secure .gov websites use HTTPS
A lock (
) or https:// means you've safely
connected to the .gov website. Share sensitive
information only on official, secure websites.
Schematic illustration of three main patterns of mean response times (RTs) and mean interaction contrasts (MICs). L = low-intensity target; H = high-intensity target.