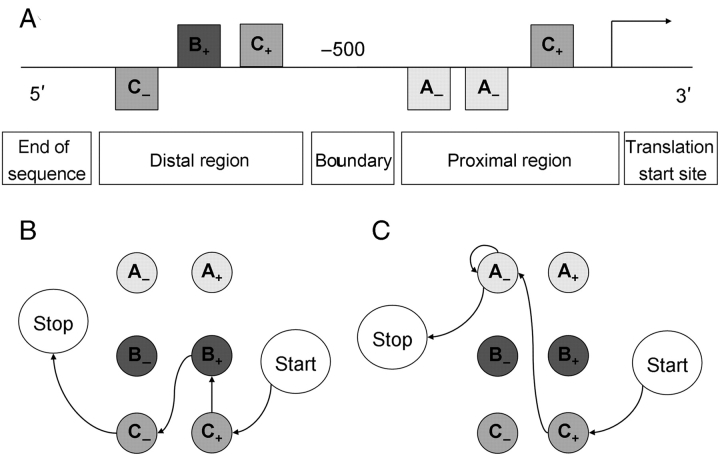
Figure 1.
A visual representation of the scoring process of the Markov chain-based promoter structure model. (A) A promoter sequence to score. The arrow on the right indicates the translation or transcription start site. The squares represent predicted TFBSs for motifs A, B, and C, with ‘ + ’ and ‘ − ’ indicating their orientation. The promoter sequence is divided into a proximal and a distal region with the boundary between these regions, here set at −500 bp. (B) and (C) A visual representation of the promoter model during the scoring process of the distal region and the proximal region, respectively. The states of the model are shown as circles. Each of the two regions has a ‘start’ and a ‘stop’ state, in addition to states for each motif type in both orientations. To score the sequence shown in (A), in the proximal region of the promoter a transition is made from ‘start’ to ‘C+’, from ‘C+’ to ‘A−’, from ‘A−’ to ‘A−’ and finally from ‘A−’ to ‘stop’, corresponding to the TFBSs predicted in the proximal region of the promoter. The score of the proximal region is the sum of the LLR values associated with each of these transitions (e.g. LLRproximal(C+ | start) for the transition from ‘start’ to ‘C+’, etc.). This process is repeated for the distal part of the promoter, and the final score of the promoter is the sum of the scores of both regions.

