Figure 1.
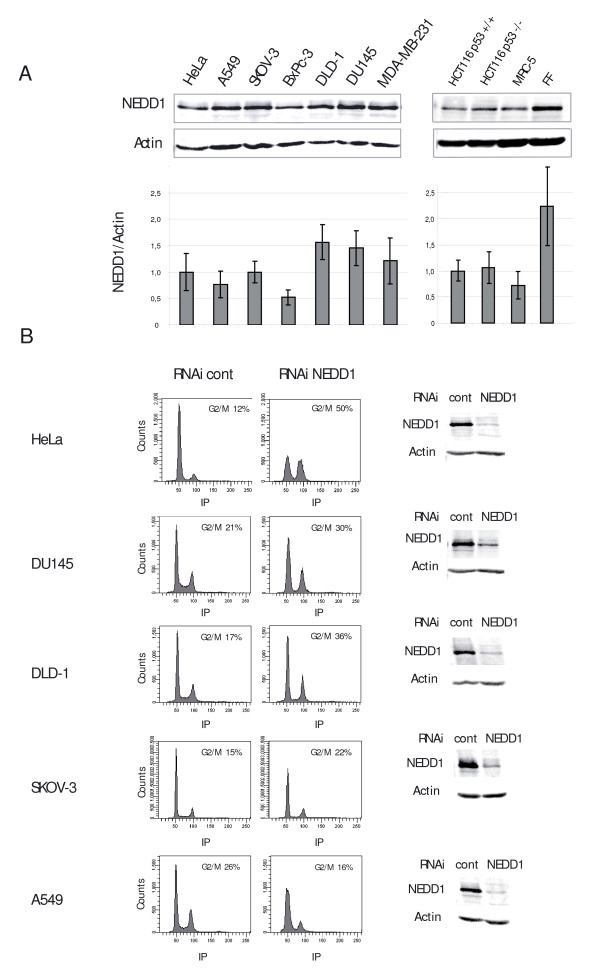
NEDD1 expression levels in cancer cell lines and effect of depletion on the cell cycle. (A) NEDD1 expression levels were analysed by immunoblotting using anti-NEDD1 antibody. Anti-actin antibody was used as a control. Bottom: ratio of the signals of NEDD1/actin, obtained by quantitative immunoblotting from five independent experiments (error bars represent SD). (B) Flow-cytometric analysis of cell lines treated with control siRNA or siRNA targeting NEDD1 at 50 nM for 72 h, and labelled with propidium iodide. Depletion levels of NEDD1 are shown for each cell line. Immunoblots were probed with anti-NEDD1 and anti-actin antibodies.

