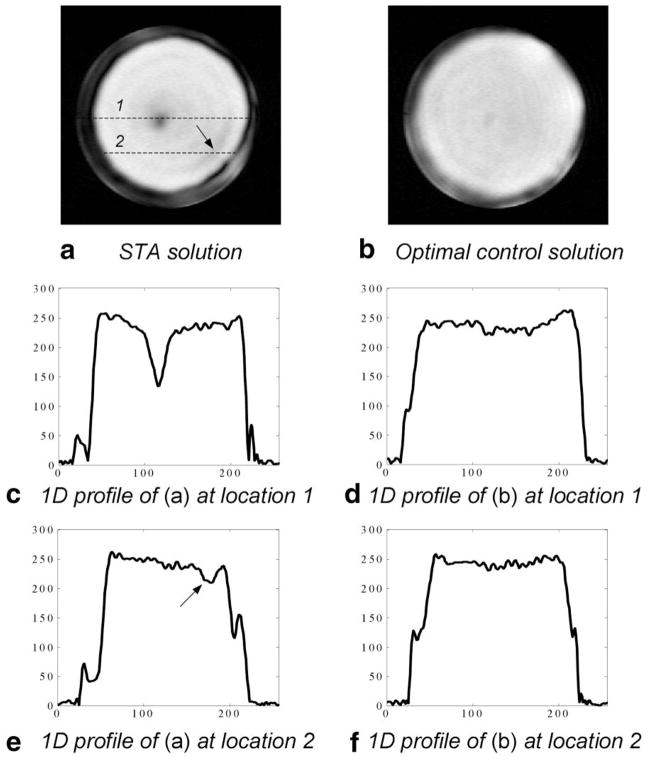
FIG. 7.
Images of the gradient echo imaging experiment in Fig. 6. a: Image from the STA pulse. There is a dark area in the center and some noticeable ripples (marked by the arrow). b: Image from the optimized pulse. The image is more homogeneous than (a). c,d: Comparison of 1D profiles from both solutions at Location 1. e,f: Comparison of 1D profiles at Location 2.

