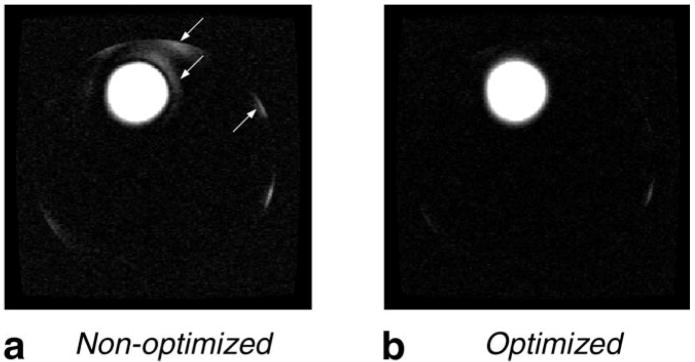
FIG. 9.
Spin-echo images from the experiment in Fig. 8. a: Image using nonoptimized pulses (STA 90° + LCLTA 180°). There were some significant artifacts as marked by the arrows. These artifacts are primarily due to the nonlinearity of Bloch equation and limited k-space coverage. b: Image using optimized pulses (optimized 90° + optimized180°). This image has a very clean “background” outside of the prescribed region.

