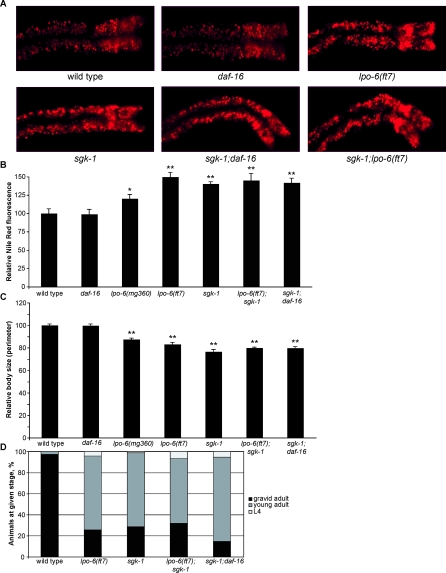
Figure 5. CeRictor and sgk-1 Define a Single Regulatory Pathway Governing Fat Storage, Body Size, and Developmental Rate.
(A) Images of Nile Red staining of lipids in anterior intestinal cells.
(B) Quantification of Nile Red staining. Mean fluorescence intensity is reported as a percentage of the mean for wild-type animals (error bars indicate s.e.m.). Single asterisk indicates p-value < 0.05, and double asterisk indicates p-value < 0.01 (wild type versus mutant, two-tailed t-test, n = 5–6). lpo-6 (ft7) is not significantly different from sgk-1 (two-tailed t-test, p-value = 0.20). sgk-1 does not statistically differ from sgk-1;lpo-6 (ft7) or sgk-1;daf-16 (two-tailed t-tests, p-values = 0.63 and 0.81, respectively).
(C) Quantification of body size. Values reported as mean size as a percentage of mean for wild type (error bars indicate s.e.m.). Double asterisk indicates p-value < 0.01 (wild type versus mutant strain, two-tailed t-test, n = 10). sgk-1 does not statistically differ from sgk-1;lpo-6 (ft7) or sgk-1;daf-16 (two-tailed t-tests, p-values = 0.11 and 0.14, respectively).
(D) Developmental timing of mutant strains. Animals were grown from synchronized L1s for 72 h at 20 °C; individuals were then scored for developmental stage. Sixty–185 animals were used for each strain.

