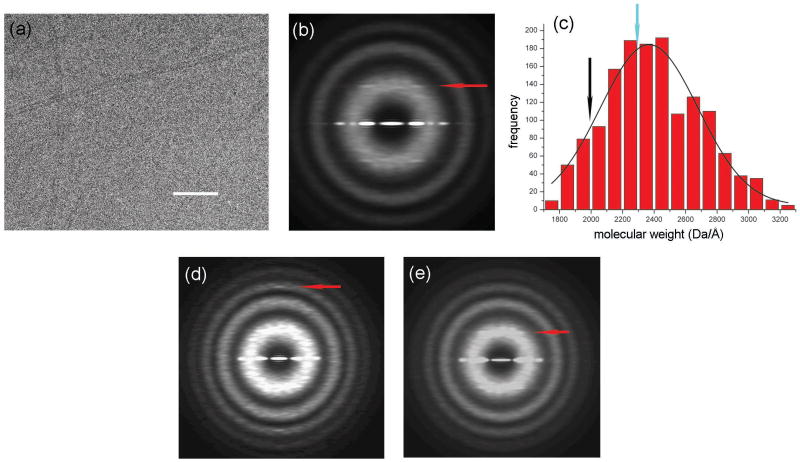
Figure 1.
Electron micrograph of frozen-hydrated F-pili (a). The space bar is 1000 Å. F-pili were prepared by a method found to minimize aggregation. F+ cells lacking type I pili were grown to an optical density of 2.0. Cells were rapidly chilled by addition of crushed ice, harvested by sedimentation, and suspended in 3 mL/L of culture of 60% (w/v) sucrose in 20 mM Tris-HCl, pH 7.6. The suspension was brought to 30% sucrose with Tris buffer and cells were removed by sedimentation. F-pili were purified from the supernatant fraction by two cycles of isopycnic sedimentation in sucrose gradients (density range = 1.16 to 1.29 g/mL). Fractions at ∼1.2 g/mL were examined by fluorescence microscopy for F-pili28 and by SDS gel electrophoresis for purity (where preparations were judged to be >90% F-pilin). Images of frozen-hydrated F-pili were collected on a Tecnai 20 field emission gun microscope at 200 keV. Imaging and analysis were done by similar methods as described previously16. Negatives were scanned with a Nikon Coolscan 8000 as 16-bit images using a raster of 2.4 Å/pixel. 10 images with defocus values in the range of 1.5–2.7 μm were selected for further processing, since the n=4 layer line has a maximum near the first maximum of the contrast transfer function (CTF) at these defocus values. All cryo-EM images were multiplied by the theoretical CTF to correct for phase reversals and to optimize the signal-to-noise ratio. An averaged power spectrum (b), generated from 10,952 overlapping segments (each 200 pixels or 480 Å in length) of frozen-hydrated pili shows one layer line (red arrow) at ∼ 1/(32.2 Å) which can be interpreted as either n=4 or n=5, based upon the distance of the peak from the meridian and the diameter of the filaments. Mass per unit length measurements from Scanning Transmission Electron Microscopy (STEM) were made by similar methods as described previously29, and yielded an average of 2,368.4 ± 8.0 (SEM) Da/Å (c). Digital STEM dark-field micrographs of freeze-dried specimens were recorded with 512 × 512 pixels at raster steps of 1.0 or 2.0 nm per pixel. The F-pili data were normalized to the known mass-per-unit-length of tobacco mosaic virus (1,314 kDa/nm). Histograms were calculated with 1-kDa/nm bins. A Gaussian was then fit to the distribution using the Origin software package (OriginLab company). The 10,952 segments from the cryo-EM images were sorted into two groups by models with either point group symmetry or one-start helical symmetry. 13% of the segments were sorted to have point group symmetry while the remaining 87% were sorted to have a one-start helix. The mass per unit length from the subset of segments reconstructed with point group symmetry (c, cyan arrow) is larger than that of the subset of segments with one-start helical symmetry (c, black arrow). The averaged power spectrum from the segments sorted as having point group symmetry (d) has a meridional layer line (red arrow) at ∼ 1/(12.6 Å). The averaged power spectrum from the segments sorted to have one-start helical symmetry (e) has a layer line (red arrow) at ∼ 1/(32.2 Å) which can be interpreted as n=4, based upon the distance of the peak from the meridian and the diameter of the filaments.

