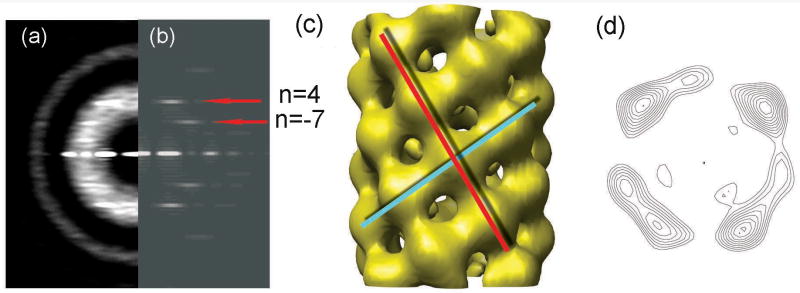
Figure 3.
The 9,488 segments of the set classified as having a one-start helical symmetry were further sorted into three subgroups by a multi-reference sorting against projections of three different initial reconstructions. The averaged power spectrum from one relatively homogeneous subgroup (containing 23% of this group) (a) is much improved compared to the averaged power spectrum before sorting (Fig. 1e), suggesting reduced heterogeneity in this subgroup. The averaged power spectrum (a) can be interpreted as having an n=4 layer line at ∼ 1/(32.2 Å) (upper red arrow) and n=-7 at ∼ 1/(51.0 Å) (lower red arrow). The reconstruction of this subgroup (c) has an axial rise of 3.5 Å and a twist of 99.6° per subunit. The reconstruction has been divided by the weighted sum of the squared CTF functions and filtered to a resolution of ∼ 13 Å as determined by the 0.5 Fourier Shell Correlation criterion. The power spectrum from the projection of this reconstruction (b) matches the corresponding averaged power spectrum (a). The surface thresholds have been chosen to enclose 108% of the expected molecular volume, since there is a loss of inner connectivity when a 100% threshold is used. We expect that this is due to limited resolution. The main connectivity between subunits is along a left-handed seven-start helix (c, red line) and a right-handed four-start helix (c, cyan line). A cross-sectional contour plot (d) shows similar outer diameter (85 Å) and lumen (30 Å) to that in the point group symmetry set (Fig. 2e,f).

