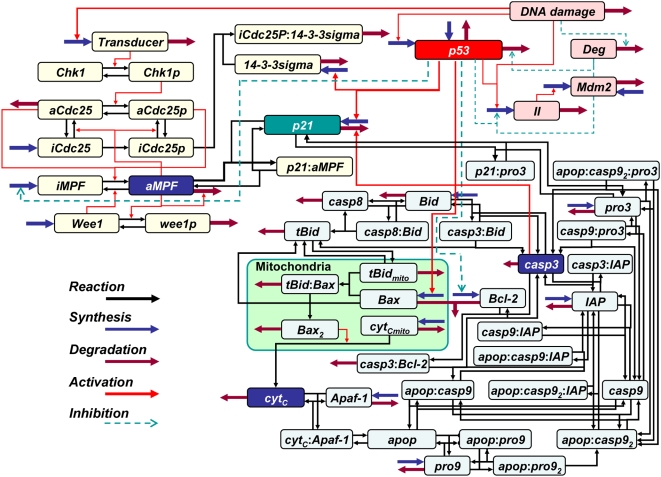
Figure 2. Proposed model reaction scheme.
Blue and russet thick arrows represent the synthetic and degradation processes, respectively. Black and red arrows show the reaction and activation, respectively, while the dashed arrow indicates suppression (see main text and supporting information for detail). Dependent variables are shown in Supporting information Table S1.

