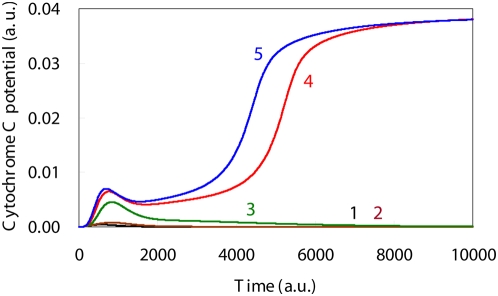
Figure 6. Simulation results for the Cytochrome C level time courses based upon DNA damage levels.
Time course of Cytochrome C levels indicated there was a bifurcation that occurs when there is induction of apoptosis. The initial DNA damage levels, which are shown by the solid lines 1, 2, 3, 4 and 5, were: 0.0, 0.001, 0.002, 0.003 and 0.004, respectively.

