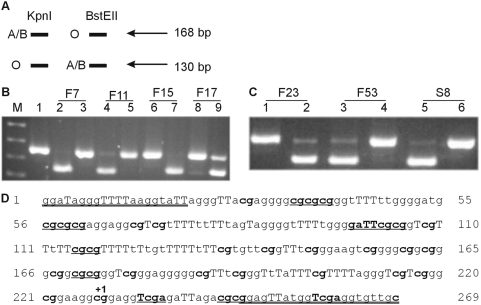
Figure 1. Loss of A expression by RT-PCR and restriction enzyme digestion.
(A) Schematic representation of ABO allelic expression analysis. KpnI digestion results in a 130 bp band if the O allele is present and no digestion of the A or B allele. BstEII digestion results in a 130 bp band if the A or B allele is present and no digestion of the O allele. (B) Lane M is the pUC19/HpaII marker while lane 1 is the uncut ABO RT-PCR product. Lanes 2, 4, 6 and 8 are digested with KpnI while lanes 3, 5, 7 and 9 are digested with BstEII. Lanes 2 and 3 are from cDNA of patient F7, lanes 4 and 5 from F11, lanes 6 and 7 from F15 and lanes 8 and 9 from F17. F7 and F11 are AO patients with loss of the A allele, F17 is an AO patient with no loss of ABO allelic expression. Patient F15 has an A1A2 genotype, hence no cutting with KpnI was expected. (C) Lanes 1, 3 and 5 are ABO RT-PCR product digested with KpnI while lanes 2, 4 and 6 are digests with BstEII. Lanes 1 and 2 are from cDNA of patient F23, an A2B genotype, hence no cutting with KpnI was expected. Lanes 3 and 4 are F53, an A1O1 patient with loss of A at the mRNA level. Lanes 5 and 6 are S8, which is a patient with an A1O1 genotype with loss of A allelic expression. (D) The ABO CpG island promoter region assessed for methylation. The methylated and bisulfite modified sequence is shown and the primer sequences are double underlined. The capital Ts identify thymines that are a result of bisulfite modification of cytosines and the CpGs are shown in bold. The start of transcription is marked with +1. The different restriction enzymes used for assessing methylation by digestion are as follows: eight BstUI sites (cg/cg), two TaqI (T/cga) sites (however one is found in the primer and hence will cut regardless of methylation status), one HinfI (g/aTTc) site. Regions 161–173 and 198–210 harbor Sp1 sites [55].

