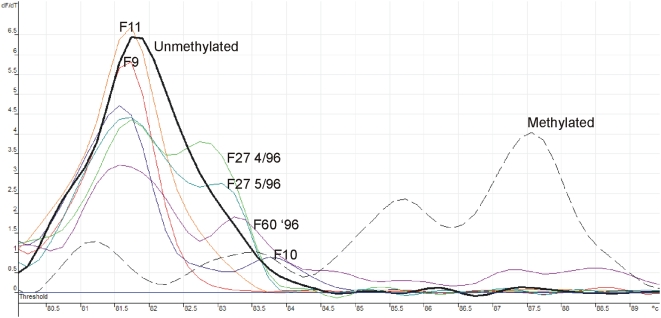
Figure 3. Melt curve analysis of the ABO BIS product in patients previously not shown to be methylated by MS-SSCA or COBRA.
The methylated pattern is shown by a dashed line while the unmethylated with a dark black solid line. F9 and F11 both have loss of the A1 allele but are unmethylated. F10 and F60 '96 are patient samples with no ABO allelic expression and show evidence of methylation by melt curve analysis. F27 is an A1O1 patient with loss of the A1 allele and methylation of 2 different samples, a month apart, which we had previously shown had increasing loss of ABH antigen loss [8] and both showed evidence of methylation.

