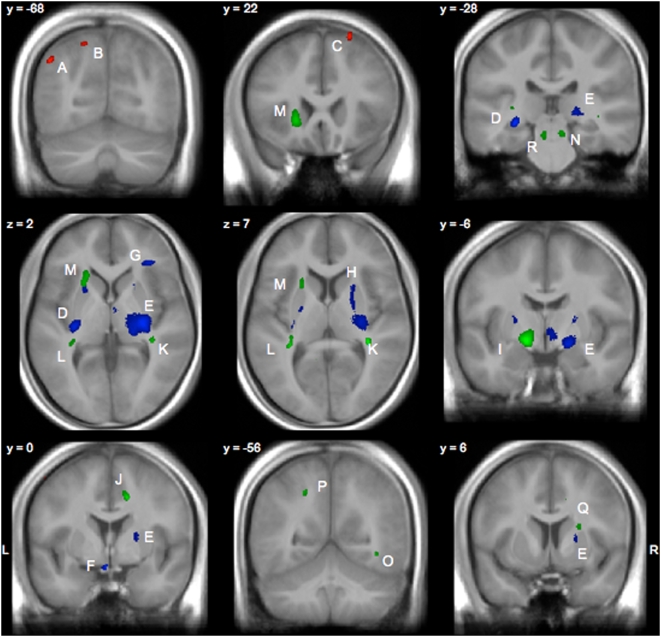
Figure 1. Structural differences in grey matter (GM, in red), white matter (WM, in blue), and fractional anisotropy (FA, in green) between skilled (SKILL1) and less-skilled golfer (SKILL2).
In GM regions, skilled golfer showed larger volumes than less-skilled golfer, whereas in WM and FA regions, skilled golfer showed smaller volumes and lower FA than less-skilled golfers. Statistical parametric maps were overlaid on the mean image of the 40 subjects under investigation. Letters refer to the clusters listed in Table 1. y and z are the MNI coordinates.

