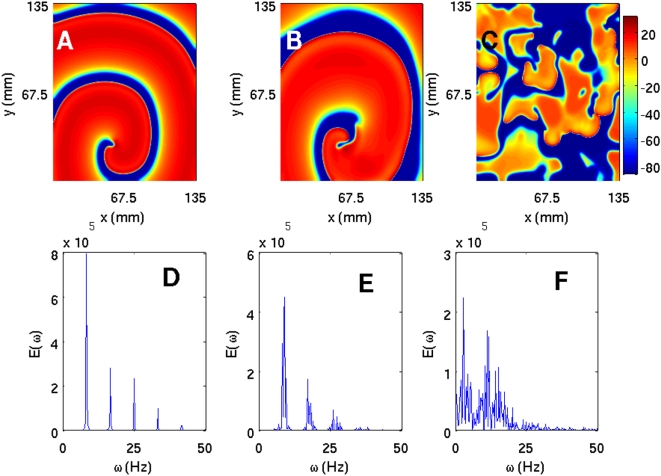
Figure 11. (Color online) The effect of GCaL on spiral waves in the TNNP model shown via pseudocolor plots of V at time t = 3.2 s and (A) GCaL = 0.000175, (B) GCaL = 0.00011, and (C) GCaL = 0.00005.
Panels (D), (E), and (F) show the corresponding power spectra of V (from a time series of 200000 iterations after the removal of the initial 80000 iterations) from the representative point (90 mm, 90 mm) in the simulation domain. These plots indicate that, as GCaL decreases, the system goes from a state with a single rotating spiral wave to the spiral-turbulence state.

