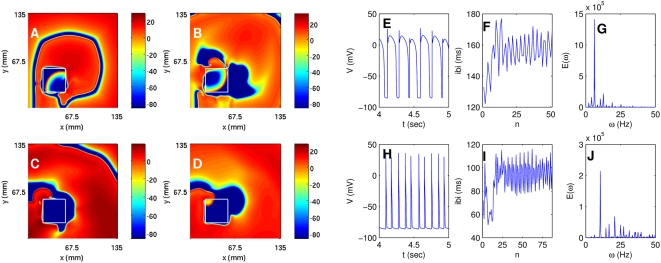
Figure 12. (Color online) The effect of a square GCaL inhomogeneity, of side 33.75 mm in a square simulation domain of side 135 mm, with  (maximal value) and
  , and placed at (22.5 mm, 22.5 mm), on spiral-wave dynamics in the TNNP model: Pseudocolor plots of V at (A) 0.08 s, (B) 0.32 s, (C) 1.2 s, and (D) 2 s; (E) the time series of V (from a sample of 50000 iterations after the removal of the initial 200000 iterations) taken from the point (11.25 mm, 11.25 mm) that lies outside the inhomogeneity.
Associated plots of (F) the IBI versus the beat number n (a sample of 400000 iterations) and (G) the power spectrum of V (from a sample of 200000 iterations after the removal of the initial 200000 iterations) indicating quasiperiodic temporal evolution [the peaks in the power spectrum can be indexed (see text) in terms of three incommensurate frequencies (2.25, 4.25, and 6.25 Hz)]. Figures (H), (I), and (J) are the analogs of (E), (F), and (I), respectively, when data for V are recorded from the point (33.75 mm, 33.75 mm) that lies inside the inhomogeneity; here too we have quasiperiodic temporal evolution with three underlying incommensurate frequencies (4, 6.25, and 10.5 Hz).

