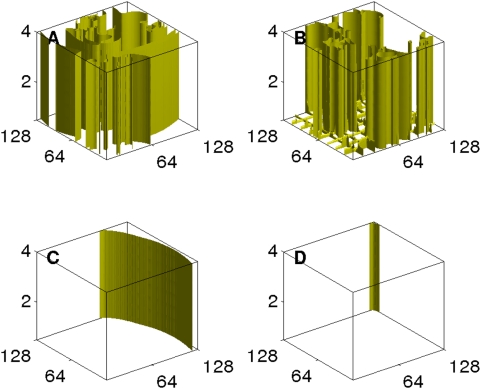
Figure 14. (Color online) The control of scroll-wave turbulence in our simulation of the 3D Panfilov for Lz = 4 mm in a domain of size 128×128×4 mm3: An iso-surface plot of V shows the initial state in (A).
A series of 32 pulses, each lasting for 0.22 ms, and separated by 220 ms is applied on the bottom of the domain on a mesh; the subsequent evolution of of the scroll waves is shown at 440 ms (B), 1760 ms (C), and 1870 ms (D) by which time we see the last wave moving out of the simulation domain.

