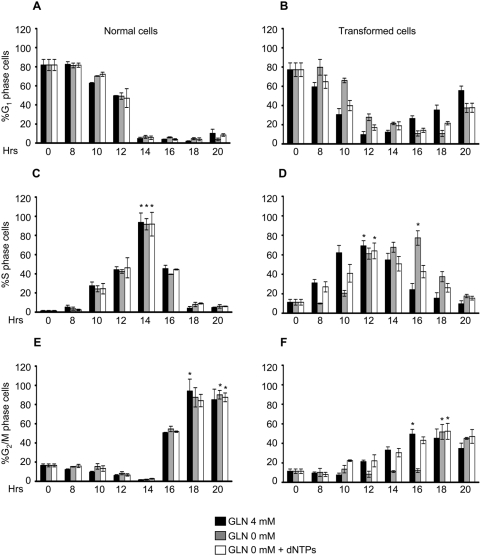
Figure 7. Cell cycle of synchronized normal and transformed cells released in 0 mM glutamine±dNTPs.
Normal and transformed cells, synchronized by 24 hours of serum starvation, were released in a medium containing 10% serum, 4 mM or 0 mM glutamine, dNTPs and BrdU for continuous DNA labeling. At indicate time points the cells were collected and stained with propidium iodide and anti-BrdU specific antibody and analyzed by flow cytometry. The percentages of cells in G1 (panels A and B), S (panels C and D) and G2/M (panels E and F) phase of normal (left panels) and transformed (right panels) cells released in 4 mM and 0 mM glutamine alone or plus dNTPs obtained by bi-parametric analysis are represented. The asterisks indicate the S or G2/M phase peaks identified in both glutamine availability. The error bars correspond to standard deviations of triplicate analysis.

