Figure 5.
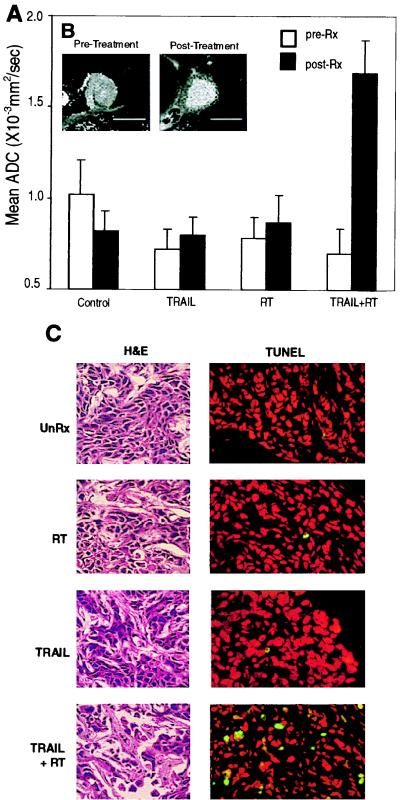
Noninvasive imaging of TRAIL- and radiation-induced apoptosis activity as monitored by diffusion MRI. (A) Serial histograms of ADC values in control and treated tumors. Mice were imaged at day 0 and 7 days after start of various treatments. The bar graphs displayed are the mean ADC value across pixels within region of interests defined on a representative animal from each treatment or control group. Region-of-interest areas were drawn over three consecutive MR slices near the rim of the respective images for each tumor studied. Graphed are the mean ± SD of ADC values for the regions of interest within a given tumor. (B) Isotropic ADC images of a representative tumor before and after TRAIL and radiation treatment. Pixel intensity is directly proportional to the measured ADC. There is a noticeable increase in water mobility after radiation- and TRAIL-combined treatment. Such an increase was not observed in the control or when the treatments were used individually (data not shown). (C) Imaged tumors were then assessed for apoptosis. Tumors were sectioned and subsequently stained with hematoxylin and eosin (H&E) or TUNEL. TUNEL-positive cells stain green. Nuclei are counterstained red with propidium iodide.

