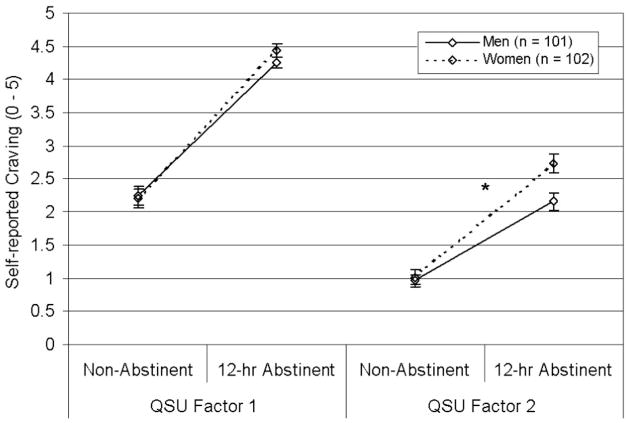
Figure 1.
Effects of gender on QSU ratings. Mean scores per item (±SEM) by state and gender are displayed. This graph illustrates a trend-level Gender × State (abstinent vs. nonabstinent) × Subscale (Factor 1 vs. Factor 2) interaction, F(1, 200) = 3.18, p = .08. Women reported greater abstinence-induced increases in urge to relieve negative affect by smoking (Factor 2) than men; however, there were no gender differences in abstinence-induced changes in urge to attain positive effects of smoking (Factor 1). QSU = Brief Questionnaire of Smoking Urges. *p < .01, Gender × State interaction.

