
Fig. 3. Results of B cell differentiation.
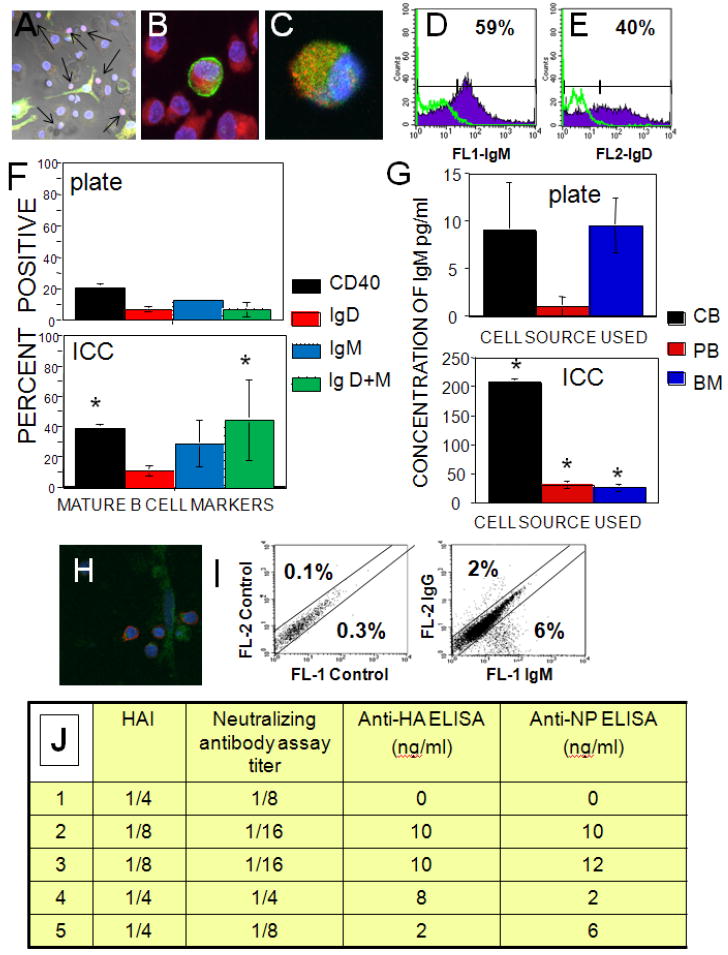
(A-C) Confocal microscopy images of 7μm sections of hydrogel scaffolds supporting CD34+ HSCs from cord blood. DAPI nuclear stain is blue for all images. (A) Nuclear RAG-1 (red) expression and surface expression of IgM (green), day 7, 200X. Arrows point to RAG-1 positive nuclei. (B) Cell surface co-expression of CD19 (red) and IgM (green), day 14, 630X. (C) Co-expression of cell surface IgM (green) and IgD (red) day 28, 630X. (D-E) Flow cytometric evaluation of cell surface expression of immunoglobulin M or D from one representative experiment for (D) IgM and (E) IgD. 10,000 events were collected for all samples, isotype controls shown as green overlays. (F) The average expression of CD40, IgM, IgD and IgM+IgD co-expression for plate and ICC cultures using CD34+ from cord blood (6 independent experiments). (G) Comparison of IgM production for LPS stimulated plate and ICC cultures from cord blood (CB), peripheral blood (PB) or bone marrow (BM) CD34+ HSCs. (H) Confocal micrograph of 7 μm section of ICC culture stained for expression of IgG (red) and CD105 (stromal cell marker, green). (I) Flow cytometry data for IgG versus IgM expression from one representative experiment showing class switch for cord blood CD34+ HSC cells after exposure to heat killed-influenza virus. 10,000 events each, isotype control data are on the left plot. (J) Evaluation of specific influenza antibody production by HAI assay, neutralizing antibody assay titer, anti-HA IgG antibody ELISA, and anti-nuclear protein (NP) ELISA (5 experiments each). Results are arranged according to the lowest dilution of culture supernatant exhibiting inhibition in case of HAI and neutralizing antibody or ng/ml concentrations of corresponding proteins in case of anti-HA and NP ELISAs.