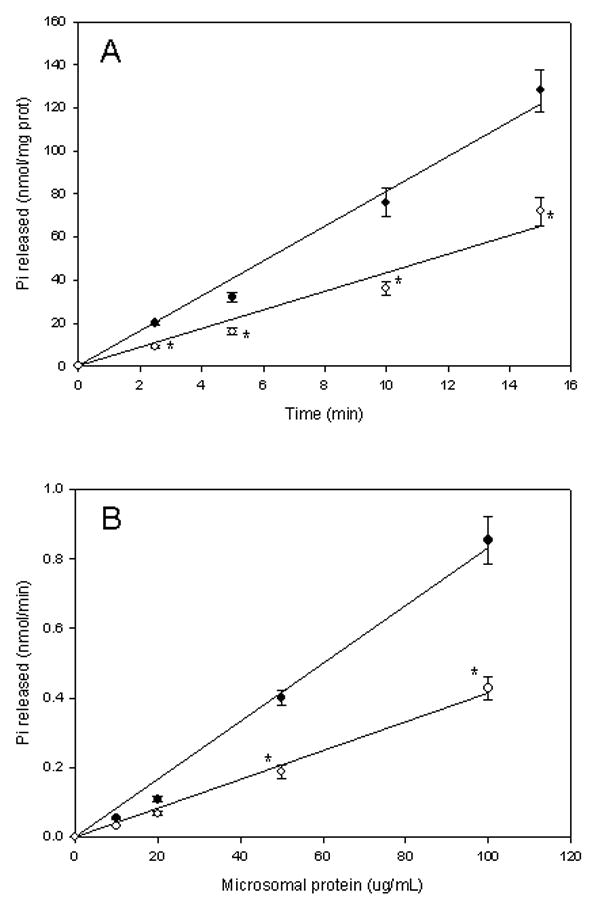
Figure 1.

Microsomal Ca2+-ATPase activity in HepG2 cells. (A) Time curve. Microsomes (0.1 mg protein/mL derived from C34 (black circles) or E47 cells (white circles) were incubated in the presence of 1 mM ATP, 20 μM free Ca2+ for variable periods (up to 15 min). The release of inorganic phosphate was measured following Materials and Methods; (B) Microsomal protein concentration curve. Microsomes (variable protein concentration up to 0.1 mg/mL) derived from C34 (black circles) or E47 cells (white circles) were incubated in the presence of 1 mM ATP, 20 uM free Ca2+ for 15 min. The release of inorganic phosphate was measured as described in Materials and Methods.
* significantly different (p<0.05, ANOVA) with respect to control C34 cells.
