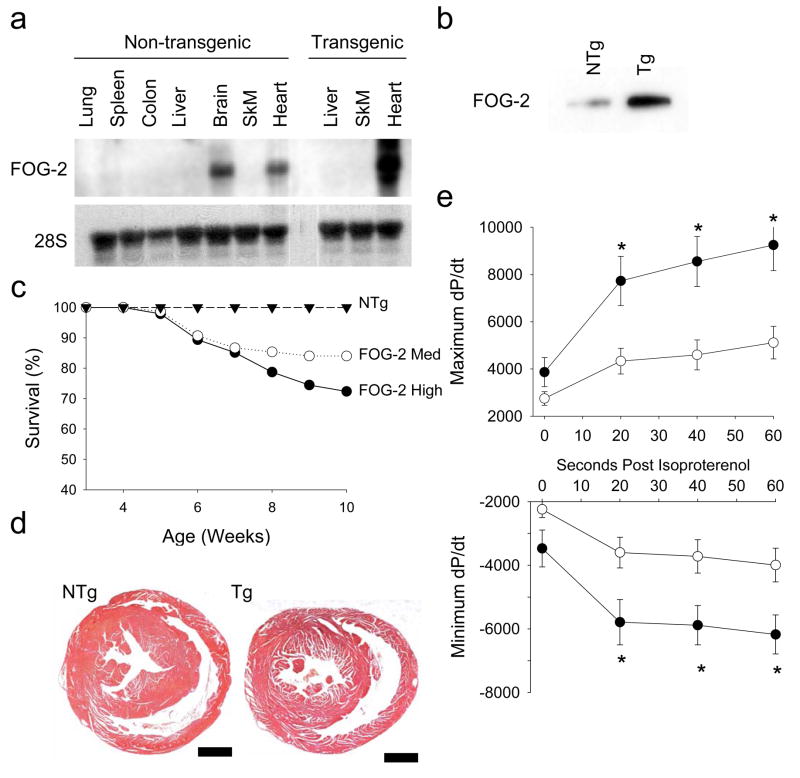
Figure 2. Generation and characterization of FOG-2 tran sgenic mice.
(a) Northern and (b) Immunoblot analysis comparing organ and ventricular FOG-2 expression in FOG-2-med Tg and NTg littermate control mice. 28S is an RNA loading control. (c) Kaplan-Meier survival analysis of FOG-2-med Tg (○, n=75), FOG-2-high Tg (●, n=46) and NTg littermate control (▲, n=44) mice. Differences in survival rates between the Tg and NTg groups were significant by the log rank test (p<0.05). (d) Representative coronal sections of hearts from NTg littermate control and FOG-2-med Tg mice showed no gross hypertrophy of the ventricles. Scale bar, 100 μm. (e) Hemodynamic analysis of FOG-2-med Tg and NTg littermate control mice. The mean±SEM maximum (top panel) and minimum (bottom panel) first derivative of left ventricular pressure tracings (dP/dt) measured at baseline and at indicated time points following stimulation with isoproterenol. Reductions in both maximum and minimum dP/dt in the Tg (●, n=11) compared with NTg (○, n=9) were noted following isoproterenol. Two-way ANOVA with repeated measures followed by Bonferroni analysis, *, p<0.05 versus NTg.

