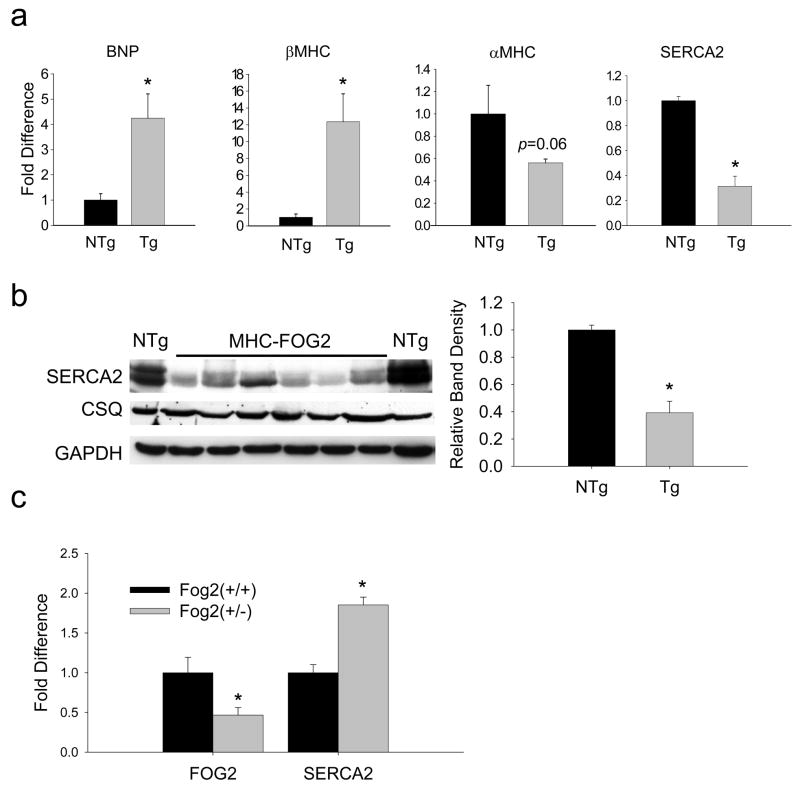
Figure 3. FOG-2 mice ventricles show fetal gene expression pattern including repression of SERCA2.
(a) Fold difference of BNP, βMHC and αMHC and SERCA2 mRNA transcripts, each normalized to GAPDH mRNA in 4–6 wk old FOG-2-high Tg mice (n=4) relative to NTg littermate controls (n=4) measured by qRT-PCR. (b) Immunoblot analysis of SERCA2, CSQ and GAPDH protein in ventricular myocardium from FOG-2-high Tg mice. SERCA2 band density normalized to CSQ. (c) Increased SERCA2 protein and reduced FOG-2 protein seen in FOG-2 heterozygote null ventricles. Unpaired t-test, *, p<0.05 versus NTg.

