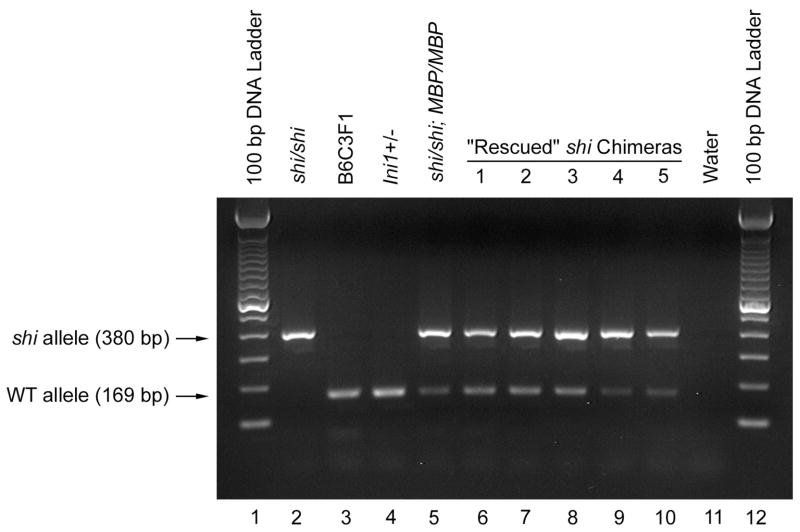
Fig. 2.
Agarose gel electrophoretic analysis of PCR amplification for the shi and WT alleles, displayed as 380- and 169-bp amplification products, respectively, from brain genomic DNA of shi/shi (Lane 2), B6C3F1 (Lane 3), Ini1+/− (Lane 4), shi/shi; MBP/MBP (Lane 5), and the 5 “rescued” shi chimeric (1, 2, 3, 4 and 5; Lanes 6 – 10) mice. The size of the amplification products was determined by reference to the 100-bp DNA ladder (Lanes 1 and 12). For negative control, water was used in place of genomic DNA as template (Lane 11).

