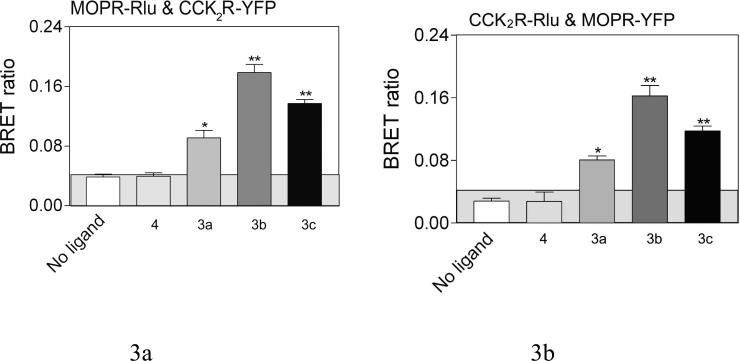
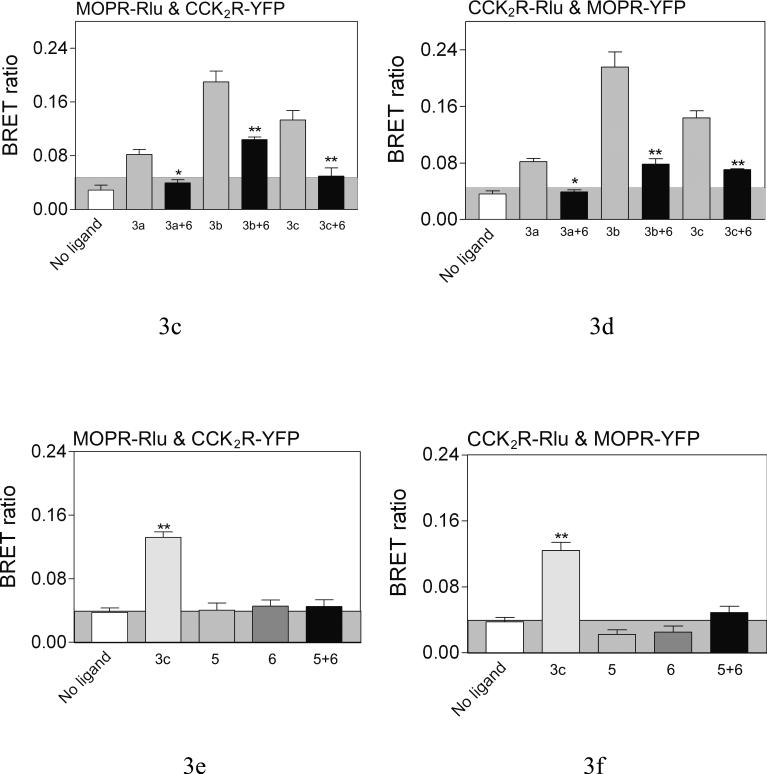
Figure 3. Effects of bivalent ligands on heterodimerization of CCK2 and MOP receptors.
Shown are BRET ratios for COS cells expressing both tagged MOP and CCK2 receptor constructs with or without incubation of various bivalent ligands (10−6 M, 90 min at room temperature). The panels on the left reflect Rlu-tagged mu-opioid receptor expressed with YFP-tagged CCK2 receptor, while those on the right represent the opposite. The panels in the top row illustrate BRET ratios for these cells in the absence of ligand and in the presence of bivalent ligands of various spacer lengths. The panels in the second row reflect the saturability of the BRET ratios in the presence of the bivalent ligands that normally give a significant signal, that are reduced in the presence of competing monovalent CCK antagonist ligand 6. The panels in the third row demonstrate that monovalent ligands that recognize only the CCK2 receptor or the opioid receptor, even when mixed together, failed to produce the BRET signal observed with the bivalent ligand. The shaded area represents the non-specific BRET signal as described in Figure 2. Values represent means±S.E.M. of data from five independent experiments. * p<0.05, ** p<0.001.


