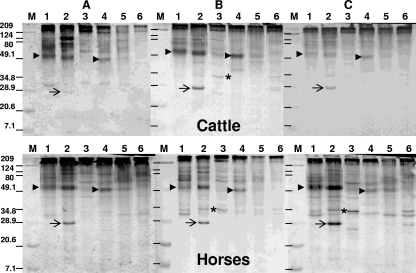
FIG. 2.
Western blot analysis of the three serum samples collected from cattle with pythiosis (A to C, upper panels) and the three serum samples collected from horses with pythiosis (A to C, lower panels). Lanes: 1, MTPI-19; 2, MTPI-04; 3, MTPI-12; 4, MTPI-14; 5, MTPI-21; and 6, MTPI-24. Arrows, the ∼28-kDa antigen on strain MTPI-04; asterisks, the ∼34-kDa antigen; arrowheads, the ∼51- and 49-kDa-molecular-mass immunodominant antigens detected by the antibodies of cattle and horses; lanes M, molecular mass markers (the numbers on the left are in kilodaltons); dashes in lanes M in panels B and C, the estimated locations of the molecular mass markers on those membranes.

