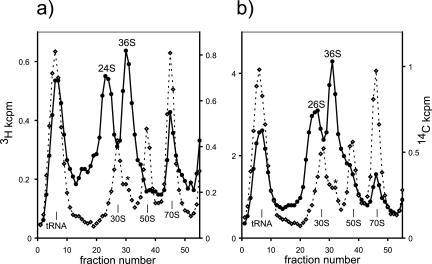
FIG. 3.
Effect of erythromycin on assembly in vivo. Methods are described in the legend of Fig. 2, but erythromycin was added to a concentration of 50 μg/ml 10 min before the addition of the 3H pulse-label. A precursor that accumulates sufficiently to be visible in both 14C-labeled and absorbance profiles is marked by an asterisk. Times of labeling in minutes (and generations) were 1 min 10 s (0.02 generations) (a) and 4 min (0.09 generations) (b). Approximate sedimentation values are given on the plots for material akin to the p130S and p150S precursors. kcpm, counts per minute (103).

