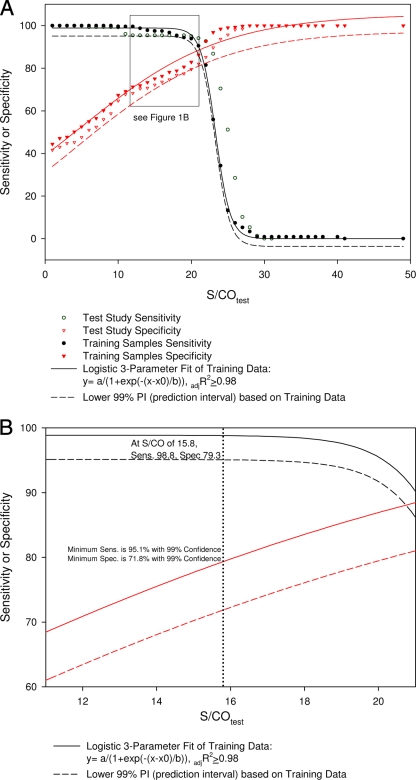
FIG. 1.
Effect of the S/COtest value on sensitivity and specificity. Results from the first study were used to generate the regression model and lower 99% PI as described in the text. The graph in panel A was overlaid with results from the masked study with additional specimens to verify the model. Panel B focuses on the area where the S/CO value is set to maximum sensitivity (sens.). adjR2, adjusted R2 value; spec., specificity.

