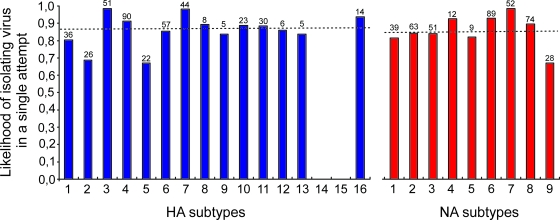
FIG. 2.
Likelihood of positive results during the first virus isolation attempt for 482 influenza A virus isolates obtained during wild bird surveillance studies. Blue bars, HA subtypes 1 to 16 (of note, HA subtypes 14 and 15 were not detected in this study); dotted line above the blue bars, the median (0.870) of the likelihood of positive results during the first virus isolation attempt for HA; red bars, NA subtypes 1 to 9; dotted line above the red bars, median (0.840) of the likelihood of positive results during the first virus isolation attempt for NA. The numbers above the bars indicate the numbers of viruses with a particular HA or NA subtype that were isolated during the first attempt.

