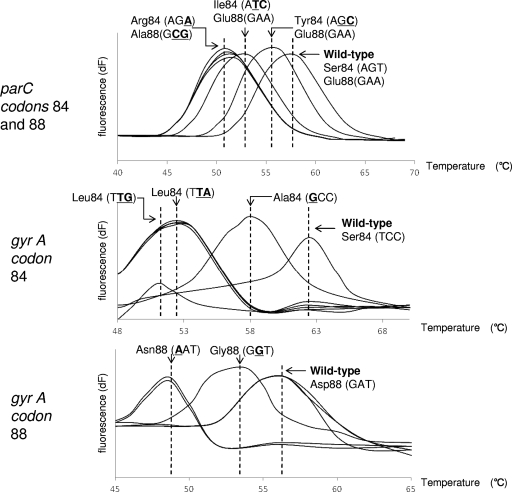
FIG. 1.
Melting peak patterns for QRDR mutants with substitutions in parC and gyrA. MCA was performed with the 175-bp amplicon of the parC gene and the 197-bp amplicon of the gyrA gene. Top, middle, and bottom panels show melting peak patterns for codons 84 and 88 of the parC gene, codon 84 of the gyrA gene, and codon 88 of the gyrA gene, respectively. Each value on the y axis reveals the ratio of the first negative derivative of the change in fluorescence (dF) to the variation in temperature.

