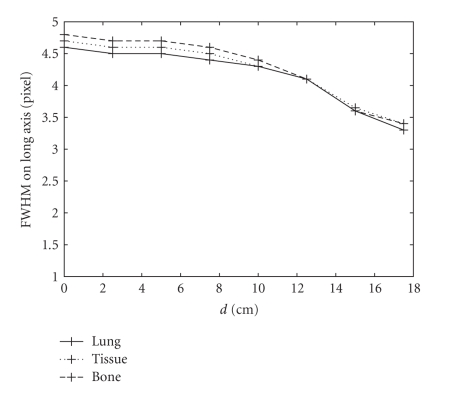
Figure 6.
Variations in FWHM on the long axis of the 2D-PSF as a function of d from eight-point Monte Carlo simulations. Solid, dotted, and dashed lines represent the simulation using a uniform attenuation map with coefficients of 0.04 cm−1 (lung), 0.15 cm−1 (soft tissue), and 0.25 cm−1 (bone), respectively.

