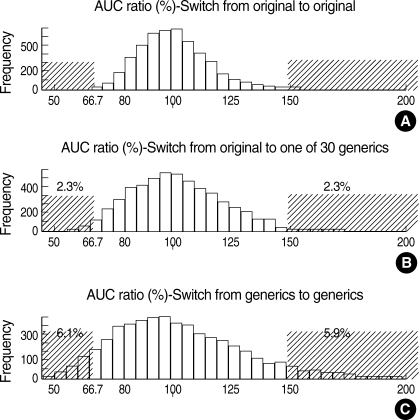
Fig. 1.
Simulation results of scenario D, one of the four scenarios. Each histogram represents the AUC ratios of 5,000 virtual patients. The generics in scenario D had a Pop Mean AUC ranging from 80-123.5 (original: 100) and an RV of 10-15% (original: 10%). The proportion of patients falling outside of the ratio margin 0.67-1.5 (shaded zone) was also included. (A) The AUCs fluctuate even when the same patient takes the same original formulation on two occasions because of the RV value, given as 10% in this scenario. (B) AUCGen1_i/AUCOri_i1 in the case of switch from the original to a generic. (C) AUCGen1_i/AUCGen2_i in the case of switch from a generic to another generic.

