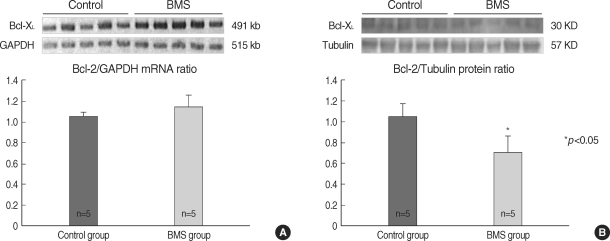
Fig. 5.
Representative expression of Bcl-XL mRNA and protein. ▓, control group; ▒, BMS group. (A) On the semi-quantitative RT-PCR, the Bcl-XL/GAPDH mRNA expression were not different between the two groups. (B) On the immunoblot analysis, the Bcl-XL/tubulin protein expression was decreased significantly in the BMS group as compared with the control group.

