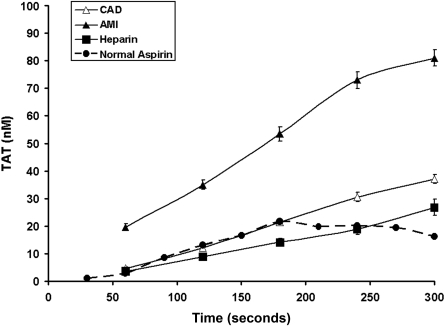
Figure 1.
Time course formation of TAT complexes. The formation of TAT for CAD patients (▵, n = 28), AMI patients (▴, n = 28), and heparin-treated AMI (■, n = 8). Values are plotted as means plus or minus SEM for all subjects in each cohort. Historic data for healthy volunteers taking aspirin are also presented ( , ●).
, ●).

