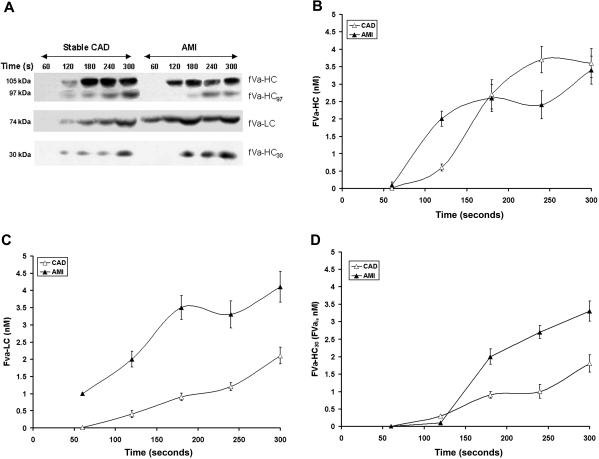
Figure 4.
Factor V activation and inactivation. (A) Representative immunoblots for fV cleavage products identified in consecutive 60-second bleeding time blood samples separated on a 5% to 15% linear gradient SDS-PAGE gel under reducing conditions from a stable CAD patient and a patient with AMI. The products identified include fVa-HC, fV-HC cleaved by thrombin (fVa-HC97) fVa-LC, and fVa-HC 30-kDa fragment produced by activated protein C. (B) FVa-HC production is presented as a function of time for the stable CAD patient population (▵) and the AMI patient population (▴). Data are plotted as the means plus or minus SEM. (C) FVa-LC production for the 2 patient populations are presented as a function of time. Data are plotted as mean plus or minus SEM for the AMI population (n = 28, ▴) and the CAD population (n = 28, ▵). (D) Time course of presentation of the 30-kDa fragment of fVa-HC is presented for the AMI cohort (▴) and the CAD cohort (▵). Each data point represents the entire cohort (n = 28) in each case and are plotted as the mean plus or minus SEM.

