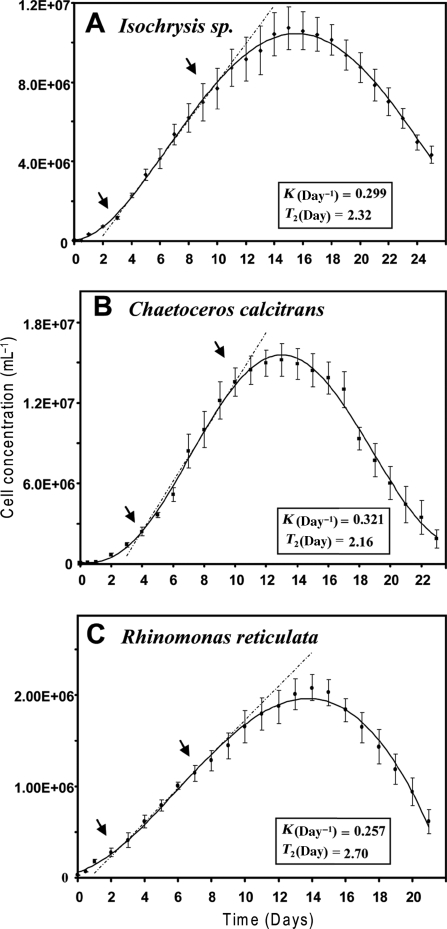
Fig. 3.
Growth curves at 20°C under continuous illumination for algae used as food sources. Cell concentrations (C, cells mL−1) at times (T, days), were calculated from optical densities using the species specific equations defined in Fig. 2. Growth rates were determined using the equation K = (lnC2−lnC1)/(T2−T1): where K is the growth rate (days−1) and lnCx are the natural logarithms of cell concentrations at the time points Tx. The intersection points (arrows) of the broken lines with the growth curves indicate the lower (T1) and upper (T2) limits of the linear growth phases of the algal cultures that were used for feeding. Doubling times (T2, days) were calculated as T2 = ln2/K. Vertical bars indicate standard errors (N = 6).

