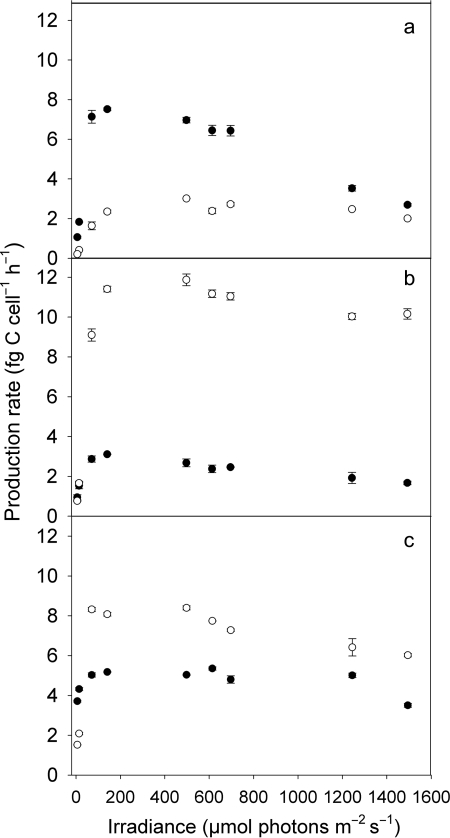
Fig. 1.
Cell-specific production rate (fg C cell−1 h−1) of PE-rich picocyanobacterial strain MW4C3 (a) and of two PC-rich strains, MW100C3 (b) and BO8801 (c), after photoacclimation to low light (LL, 10 µmol photons m−2 s−1; filled symbols) and moderate light (ML, 100 µmol photons m−2 s−1; open symbols) intensity. Symbols denote mean values and standard error.

