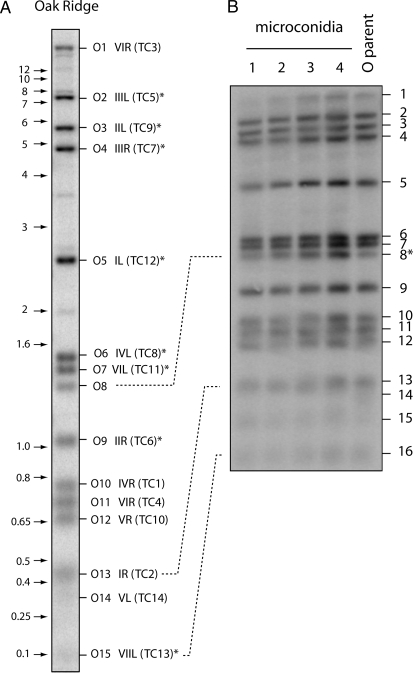
Figure 1.—
Telomere restriction profiles of the N. crassa OR strain. Genomic DNA was digested with HindIII plus NotI and fractionated by electrophoresis through agarose gels. The gels were blotted to nylon membranes and probed with the 32P-labeled telomere repeat sequence. The resulting phosphorimages are shown. (A) HindIII/NotI restriction profile of OR. The positions of size markers are shown on the left (in kilobases) and hybridizing bands are numbered, from largest to smallest, on the right. The corresponding TelContig numbers are shown in parentheses. Asterisks mark bands whose TelContig associations were confirmed by characterizing the relevant cosmid clones. Bands 14 and 15 do not reproduce well but were clearly visible upon overexposure of the phosphorimage. (B) Telomere profiles of microconidial isolates of the OR strain. Telomere bands are numbered from largest to smallest. The fragment marked with an asterisk is the only one that did not segregate with the mapping population.

